Where do the Council’s Emissions Come From?
FODC Area Emissions
1614 kt of CO2
Total carbon dioxide emissions in Fermanagh & Omagh (2019 figures)
28.8% Decrease
Fermanagh & Omagh CO2 emissions have decreased by 28.8% in the period from 2015 to 2019
10.6t of CO2
Fermanagh & Omagh has the lowest per capita carbon dioxide emissions in NI: 10.6t CO2 (2018 figures)
Where do FODC Areas Emissions originate?
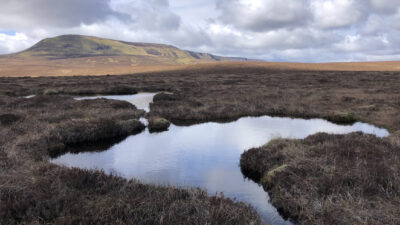
Land use, land-use change and forestry is FODC largest source of emissions.
This refers to the man-made modification of land, from a natural terrestrial ecosystem, to one which serves a different purpose. Natural terrestrial ecosystems act as a carbon sink, by sequestering carbon from the air. The repurposing of this land, decreases this carbon sink, resulting in an net increase in carbon emissions.
| Group | % |
|---|---|
| Agriculture | 6.86 |
| Commercial | 1.80 |
| Domestic | 12.76 |
| Industry | 17.44 |
| Land use, land-use change and forestry | 37.85 |
| Schools / Hospitals | 0.56 |
| Transport | 22.74 |